Fiscal year ending
March 2022
Fiscal year ending
March 2023
Fiscal year ending
March 2024
Fiscal year ending
March 2025
Fiscal year ending
March 2026
Sales
38,891
59,415
49,285
41,995
49,125
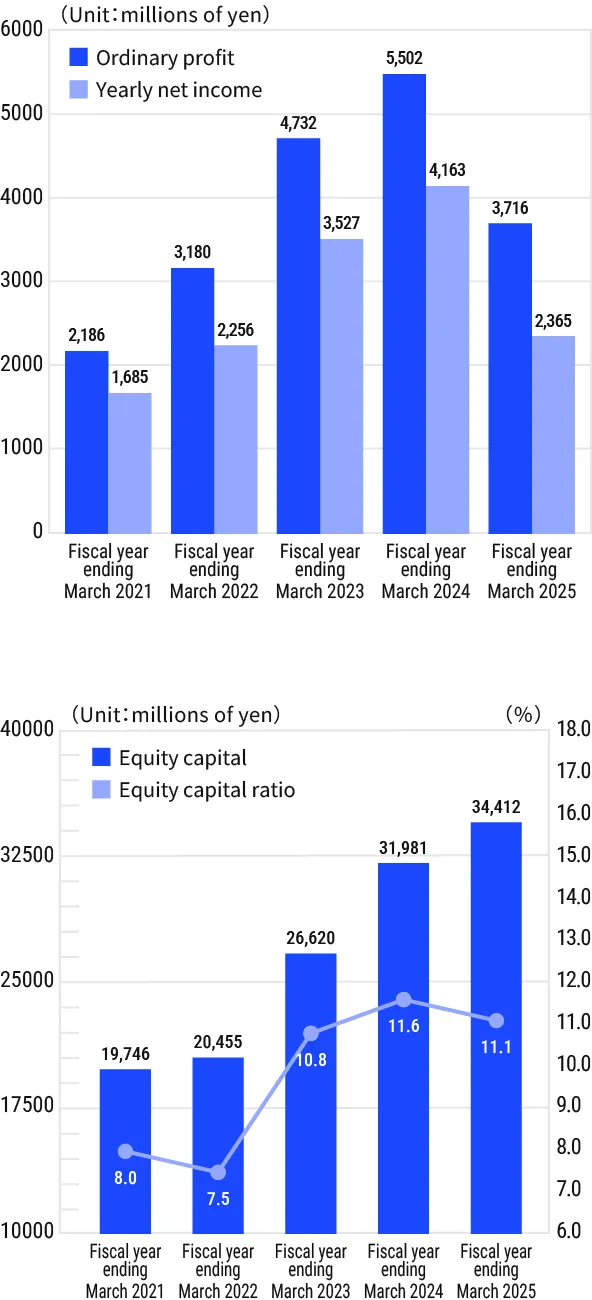
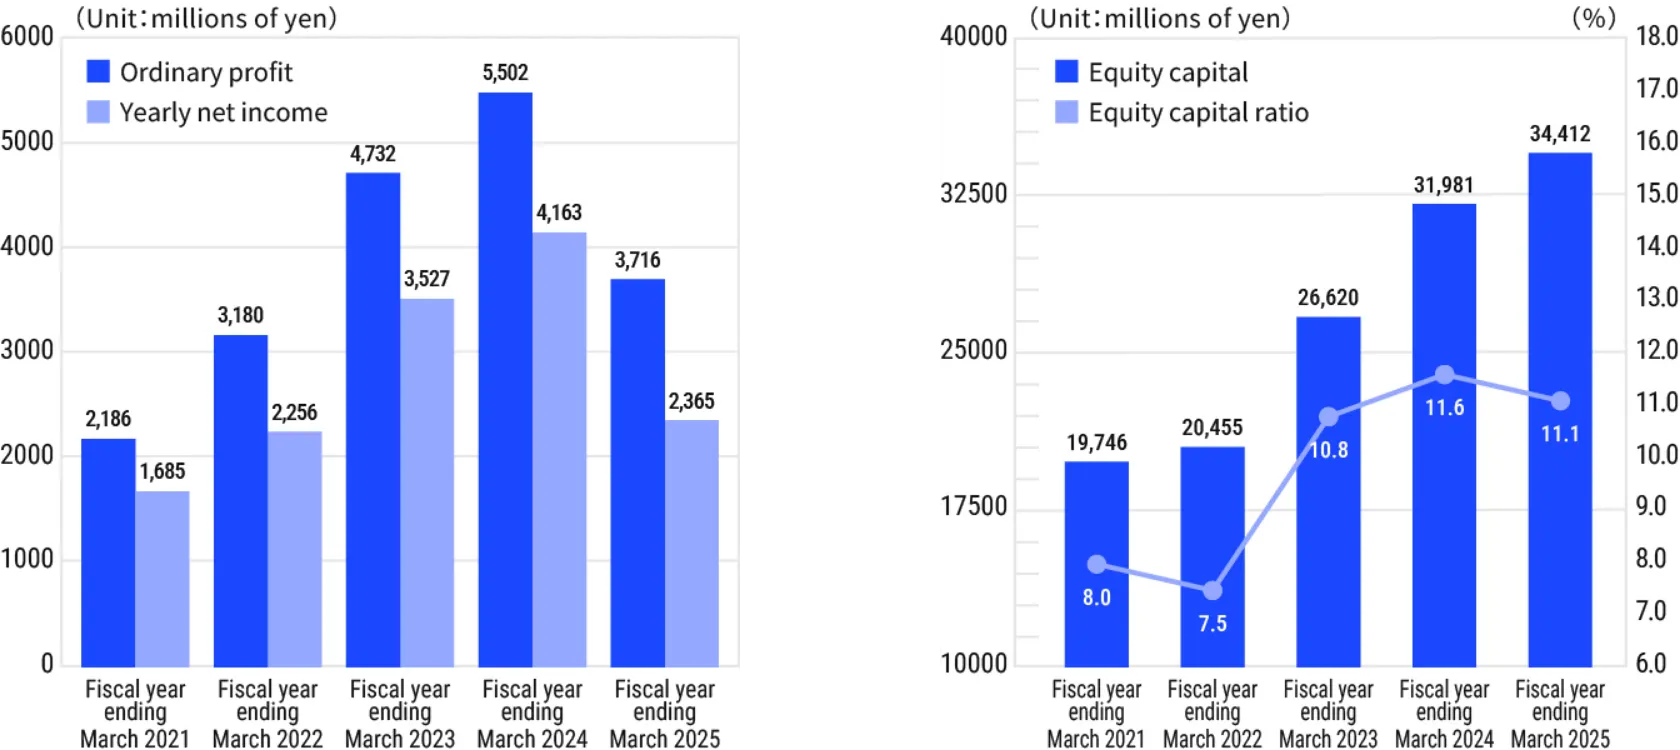
Ordinary profit
3,180
4,732
5,502
3,716
6,211
Yearly net
income
2,256
3,527
4,163
2,365
4,405
Equity capital
20,455
26,620
31,981
34,412
39,059
Balance of
business assets
257,647
233,667
264,338
299,022
368,669